Every safety manager knows the meeting. The quarterly review, the projector warmed up, a single slide with the numbers the board actually asked for: Lost Time Injury Frequency Rate, Total Recordable Injuries, days since the last incident. If the bar is lower than last quarter, there is a quiet nod of approval. If it is higher, there are questions. And in both cases, everyone in the room is looking at a photograph of the past.
That is the trouble with the metrics most companies report upward. They are lagging indicators. They count the harm that has already been done. A falling injury rate tells you that fewer people got hurt last quarter, but it tells you almost nothing about whether more people will get hurt next quarter. You are steering a moving vehicle by staring into the rear-view mirror.
The board is not asking the wrong question when it asks "are we safe?" It is being given the wrong kind of answer.
The problem with counting injuries
There is a deeper flaw in lagging indicators, and it is a statistical one. Serious injuries are, thankfully, rare. That rarity makes them almost useless as a measure of week-to-week performance. When a number is small and volatile, it swings for reasons that have nothing to do with your safety systems. A good quarter can be luck. A bad quarter can be luck. You cannot manage a process by the exceptions it throws off once a year.
The safety profession has understood this for decades. Beneath every serious injury sits a broad base of minor incidents, and beneath those, a far larger base of near-misses: the pallet that swung a foot from someone's head, the worker who stepped into a vehicle lane a half-second before the reversing truck, the moment two people occupied a space that should only ever hold one. These are the events that carry the real signal. They happen constantly. They are frequent enough to reveal patterns. And they are, by definition, the failures that did not cost anyone their health.
The problem has always been that near-misses are the hardest thing in safety to measure. They rely on someone noticing, someone caring enough to write it up, and someone not fearing that the report will be held against their team. Under-reporting is not a flaw in the system; it is the system. The events most worth counting are precisely the ones that vanish without a trace.
What your cameras already saw
Here is the shift. Most of those near-misses were filmed. The camera over the loading bay, the one watching the yard gate, the one pointed at the racking aisle — they captured every one of them and then did nothing. The footage rolled on, was overwritten in thirty days, and the signal was lost.
A computer-vision layer on that existing CCTV changes the economics entirely. It does not wait for a person to file a report. It watches every frame, on every camera, every hour, and records the events that matter: a pedestrian and a forklift sharing a lane, a worker entering a red zone, a near-fall, a missing helmet, a vehicle over the yard speed limit. Each one is timestamped, located, and logged automatically. No paperwork. No judgement. No fear of blame.
Overnight, the rarest data in safety becomes the most abundant. You are no longer counting the handful of incidents unlucky enough to cause harm. You are counting thousands of the precursors that come before harm — the true leading indicators — and you are counting them the same way every day, so the trend actually means something.
This capability was not built in a boardroom. It was forged offshore, on the drill floors of oil and gas, where heavy equipment moves in tight spaces and a missed hazard costs a life. Refined in a national oil major's operations, then proven at a major international port and airport, the detection now runs at a sub-0.05% error rate and, where it has been deployed, has cut unsafe behaviour by around 90%. The offshore pedigree matters here for one reason: if a system can read the chaos of a drill floor reliably, the near-misses in a warehouse hold no surprises for it.
Turning events into the metrics a board understands
Raw detections are not yet a leading indicator. The value comes from what you do with the volume.
Frequency and trend
Count red-zone incursions per thousand hours worked. Track it week over week. When the line climbs, you have an early warning weeks or months before that trend expresses itself as an injury. This is the number that lets you act on a problem while it is still cheap and no one is hurt.
Location and heatmapping
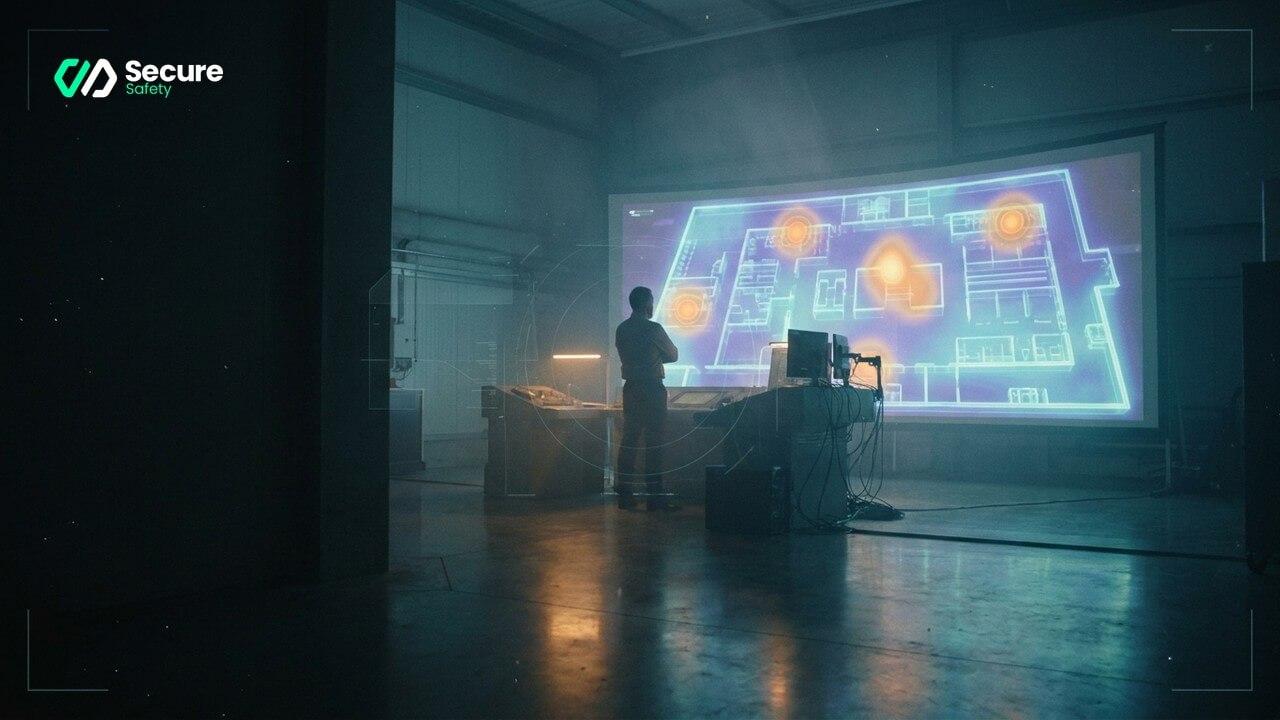
Plot every near-miss on the site floor plan and the hotspots draw themselves. A blind corner, a badly placed crossing, a stretch of aisle where vehicles and people keep converging. You are no longer guessing where to spend your prevention budget; the data points at the exact square metre.
Response and closure
Because every event carries a clip, you can measure not just what happened but how fast you fixed it. Time to review, time to close out, whether the reoccurrence rate at that spot fell after you moved the barrier. That is the language of continuous improvement, and it is exactly what a board wants to see: a problem identified, an action taken, a measurable result.
The conversation changes
Give a board a falling injury rate and you invite the only question the number supports: is it luck or is it real? Give them a leading-indicator dashboard and the conversation moves forward. Here are the three hotspots on site. Here is the trend before we intervened and after. Here is where the next incident was most likely to occur, and here is why it now won't.
That is the difference between reporting safety and managing it. Lagging indicators tell you how many people you failed to protect. Leading indicators tell you where to stand so that no one needs protecting at all. The footage to build them is already running on your walls. The only question is whether anything is watching it.
How to build a leading-indicator programme on existing CCTV
Define your monitored event categories
Before the system can generate leading-indicator data, you need to decide what counts as a leading indicator for your site. Not all near-miss categories are equally predictive: on a site with a high proportion of vehicle movement, vehicle-pedestrian conflicts and speed violations are more predictive than on a largely pedestrian site. Define three to five categories that map to your highest-risk scenarios — these become your primary monitored metrics — and treat everything else as secondary context.
Establish a baseline before changing anything
The value of leading-indicator data depends entirely on having a baseline to compare against. The first four to six weeks of a monitoring deployment should be treated as a data collection period, not an enforcement period. The goal in this phase is to understand what normal looks like on your site: how many vehicle-pedestrian near-misses happen per shift, at which locations, at which times. The baseline is what makes every subsequent measurement meaningful.
Connect the metric to a cause
A near-miss count that rises or falls without explanation is nearly as useless as no data at all. Each metric should be connected to the specific causes that drive it — which routes, which shift patterns, which vehicle classes, which contractor firms. The AI platform provides this disaggregation automatically through the clip library and location log. The safety team's job is to review the top three or four drivers of each metric on a weekly cycle and determine whether they require an engineering response, a management response or a communication response.
Report to the board with trend, not just number
A single near-miss count for the period is a data point without context. The board wants to see a trend: is the frequency rising or falling, and why? Present leading indicators with at minimum four weeks of history, a clear annotation of any significant interventions (a crossing improvement, a speed limit change, a contractor briefing) and the observed effect of each intervention on the metric. This is the language of a safety programme that is being actively managed rather than passively reported.
The metrics that matter most by site type
Logistics and warehousing: vehicle-pedestrian near-miss rate (per 10,000 vehicle-hours), PPE compliance rate at zone entries, and speed-limit exceedance rate by route.
Manufacturing: machine-guard zone violation rate, PPE compliance rate by shift, and people-counting exceedance at high-density workstations.
Offshore and heavy industry: drill-floor zone breach rate, man-down event rate (including wearable triggers), and PPE colour compliance rate by role category.
Ports and terminals: crane drop-zone violation rate, vehicle-pedestrian conflict rate at gate crossings, and quayside edge proximity event rate.
Implementation checklist for a leading-indicator programme
- Agree the primary metric categories with the safety team and site management before deployment — do not rely on the AI system to decide what matters on your site
- Set reporting cadence: weekly for the operational safety team, monthly for site management, quarterly for the board or executive committee
- Define thresholds for escalation: what level of increase in a leading indicator triggers an immediate response rather than waiting for the next review cycle
- Build an intervention log: every time an action is taken in response to a leading indicator, log it with the date, the action and the expected effect — this is the evidence of continuous improvement that auditors and insurers require
- Review the baseline quarterly: as the site changes, the baseline for each metric should be reviewed — a new contract, a layout change or a shift pattern change will affect your near-miss rates in ways that should be understood and documented, not simply tracked as unexplained variation
See what your cameras have been missing — book a demo.