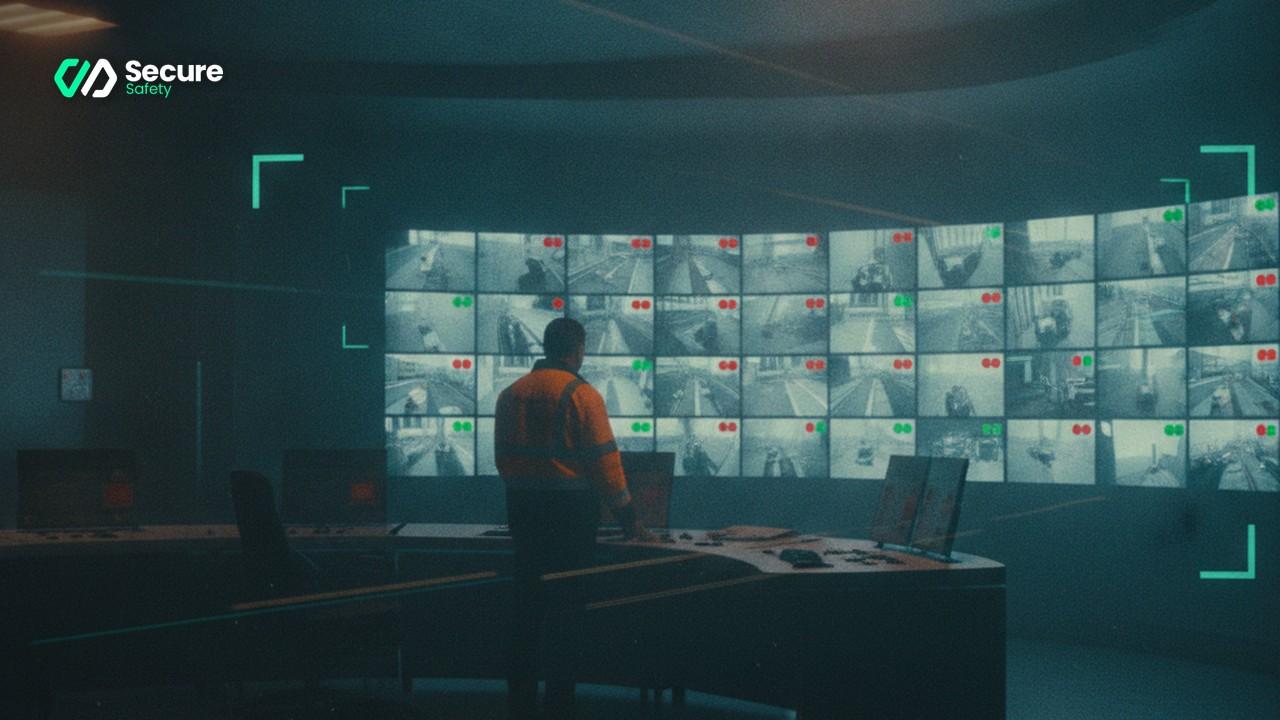
\"SecureSafety vehicle-pedestrian detection — the kind of near-miss a pSIF triage model prioritises.\"
The maintenance technician did not report the near-miss because he judged it minor. He slipped on a patch of oil near the edge of an elevated walkway, caught the handrail, swore quietly, and went back to work. His supervisor never found out. The incident register for that shift showed nothing unusual.
Three months later, a different worker on the same walkway slipped at the same location, caught nothing, and fell four metres. RIDDOR report. Ambulance. Investigation. And in every subsequent HSE interview, the phrase that kept appearing was: "There were prior warnings."
There always are. The problem is that near-misses arrive in volume, they arrive mixed with genuinely trivial events, and most organisations lack any consistent mechanism for telling them apart. Where AI monitoring is deployed at scale, that problem compounds sharply — and the organisations that do not solve it risk losing the core benefit of their investment.
Why volume without triage is dangerous
The introduction of AI-assisted monitoring makes the triage problem more acute, not less. A well-configured computer vision system running across a heavy industrial site might process 15,000 to 20,000 events per day — vehicle-pedestrian interactions flagged, restricted zone entries logged, PPE non-compliance recorded, speed exceedances noted. SecureSafety sites typically process around 18,000 events daily. That volume is the point. At that scale you are capturing what human supervisors physically cannot.
But raw volume creates its own hazard. When safety teams receive every event as equal in weight, they tend to handle the easiest ones first, or they batch-process and clear the log at the end of a shift. Neither approach reliably surfaces the event that matters most. Alert fatigue — the well-documented phenomenon in which sheer quantity of alerts causes operators to dismiss them, defer them, or stop reading them critically — is as real in an EHS context as it is in clinical or process safety settings.
A study in the Journal of Safety Research (2021) examining near-miss reporting behaviour across heavy manufacturing found that workers and supervisors regularly under-report events they classify as minor, and over-report events that generated a visible physical reaction. Neither the frequency nor the subjective urgency of a reported near-miss reliably predicts its potential consequence. The result is a log that reflects reporting culture more than actual risk profile.
The solution is not fewer alerts. It is a severity triage that happens systematically, at the point of detection, so that the most significant events surface immediately and the minor ones are logged, counted, and reviewed in aggregate rather than one at a time.
What makes a near-miss a pSIF?
The term pSIF — potential Serious Injury or Fatality — emerged from SIF-reduction programmes in the petrochemical and energy sectors in the early 2000s. Its utility is conceptually simple: a near-miss is a pSIF if, had circumstances been only slightly different, the outcome would have been a fatality or a permanent disabling injury. The worker who slipped and caught the handrail experienced a pSIF. The worker who bumped into a racking upright in a warehouse aisle almost certainly did not.
HSE's guidance on serious injuries classifies them by reference to RIDDOR 2013 (the Reporting of Injuries, Diseases and Dangerous Occurrences Regulations 2013): fractures other than fingers and toes, amputations, permanent loss or reduction in sight, crush injuries to the head or torso, injuries requiring hospital admission for more than 24 hours, and similar outcomes. The near-miss version of any of these events — the slip at height that was caught in time, the crush that stopped three centimetres short, the vehicle pass that cleared the pedestrian by a shoulder's width — is a pSIF regardless of the actual outcome on the day.
The distinction matters for three reasons. First, pSIF events have a fundamentally different causal profile from routine near-misses: they involve combinations of energy sources, proximity, and failed or absent safeguards that together create a real potential for catastrophic harm. Second, they are more amenable to investigation and correction — because the physical situation still exists (the oily patch, the missing barrier, the procedural gap), you can intervene before the outcome changes. Third, they carry disproportionate learning value. Research across safety-critical industries consistently finds that each properly investigated pSIF event typically surfaces a systemic failure driving multiple invisible risks elsewhere on the site.
The 5-point pSIF triage framework
The following framework assigns a severity score to each AI-detected event. It draws on the bow-tie risk model used in major hazard industries and on the ISO 45001:2018 framework for corrective action under clause 10.2. Applied at the point of detection — automatically by the monitoring system, or by a safety officer during rapid review — it allows events to be sorted into one of three tiers: critical (pSIF), significant (investigate within 24 hours), or minor (log and trend).
Each factor scores 1–3. Scores of 11–15 are pSIF; 7–10 are significant; below 7 are minor.
| Factor | Score 1 | Score 2 | Score 3 |
|---|---|---|---|
| Consequence severity | Minor injury potential (bruise, strain) | Serious injury potential (fracture, hospitalisation) | Fatality or permanent disability potential |
| Exposure frequency | Rare condition (occasional occurrence) | Regular condition (weekly recurrence) | Persistent condition (daily or constant) |
| Proximity to harm | Indirect — safeguard absorbed the event | Near-contact — safeguard engaged but barely | Direct contact or contact imminent |
| Barriers failed | No barriers failed; condition observed upstream | One protective barrier failed or absent | Multiple barriers failed or bypassed |
| Controls verified | Relevant controls in place and recently checked | Controls exist but not verified recently | Controls absent, degraded, or known to be failing |
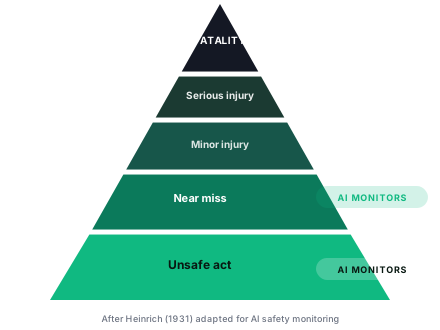 The Heinrich safety triangle. AI monitoring covers the base two tiers — near-misses and unsafe acts — at the volume and consistency that manual observation cannot achieve.
Using the framework in practice: A worker detected entering a restricted exclusion zone around an active forklift operation might score 3 (fatality potential), 2 (zone entries occur most shifts), 3 (direct proximity to vehicle), 2 (one physical barrier was found open), 2 (zone access controls not audited in six weeks) — total 12, classified pSIF, escalated immediately and requiring a named supervisor response. A PPE non-compliance at a pedestrian entrance — missing hi-vis vest, no high-energy zone nearby — might score 1, 3, 1, 1, 1 — total 7, classified significant, reviewed in the next working day's safety meeting.
The Heinrich safety triangle. AI monitoring covers the base two tiers — near-misses and unsafe acts — at the volume and consistency that manual observation cannot achieve.
Using the framework in practice: A worker detected entering a restricted exclusion zone around an active forklift operation might score 3 (fatality potential), 2 (zone entries occur most shifts), 3 (direct proximity to vehicle), 2 (one physical barrier was found open), 2 (zone access controls not audited in six weeks) — total 12, classified pSIF, escalated immediately and requiring a named supervisor response. A PPE non-compliance at a pedestrian entrance — missing hi-vis vest, no high-energy zone nearby — might score 1, 3, 1, 1, 1 — total 7, classified significant, reviewed in the next working day's safety meeting.
This is not bureaucratic box-ticking. It is a consistent thinking tool that makes severity classification reproducible across shifts, across sites, and across team members with varying experience levels. The AI monitoring system can apply the scoring automatically based on detection metadata — event type, location zone, event frequency history, known control status — and a human reviewer refines it where the context warrants.
Why AI event data enables severity scoring that manual systems cannot
The triage model above requires four types of input that manual incident reporting systems cannot reliably provide. AI monitoring provides all four as standard.
Event frequency data. A manual system captures what gets reported. An AI system captures what actually happens. The difference is substantial: research on near-miss under-reporting in UK manufacturing environments consistently finds that reported incidents represent fewer than 20% of actual events. When you can see that a particular vehicle–pedestrian interaction has occurred 43 times in the past month — compared with the two that reached the incident register — the exposure frequency dimension of the pSIF score changes dramatically.
Proximity data. Computer vision detects the actual geometric relationship between a vehicle and a pedestrian at the moment of maximum risk. This is not an estimate derived from a witness statement written four hours after the event; it is a frame-by-frame measurement with a time-stamp. A near-miss where the forklift passed at 1.2 metres scores differently from one where it passed at 0.2 metres, and the evidence for that distinction is objective.
Temporal context. An AI system time-stamps every event and can identify clustering — multiple events in the same location within a single shift, escalation patterns across consecutive days, time-of-day correlations that may indicate fatigue or lighting conditions. Manual reporting rarely captures this granularity with the consistency needed to distinguish signal from noise.
Barrier status context. Where the system monitors access controls, exclusion zones, and speed restrictions, it records whether those controls were in force at the time of the event — not what a maintenance schedule says should have been in force, but what the camera observed. This is the evidence base that makes the "barriers failed" dimension of the triage framework operationally credible rather than speculative.
Presenting pSIF rates to the board
Most boards review Total Recordable Incident Rate (TRIR) or Lost Time Injury Frequency (LTIF). These are lagging indicators: they count outcomes that have already occurred. By the time the needle moves on TRIR, someone has already been hurt.
pSIF rate — the number of potential serious-injury-or-fatality events per 200,000 hours worked — is a leading indicator. It measures the preconditions for a catastrophic event, not the event itself. A board that understands the pSIF rate for its operations has a fundamentally different view of safety risk than one reading only TRIR figures from the past quarter.
Three principles govern how to present pSIF data effectively. First, distinguish between detected pSIF events and investigated pSIF events: the detection count measures exposure, the investigation count measures response capacity. A large gap between the two is the conversation to have. Second, show the trend rather than the absolute number — a rising pSIF rate on a site where no one has been injured is a more urgent story than a flat TRIR. Third, map pSIFs to the site's critical risk register. If confined space operations are a top-three critical risk, and AI monitoring surfaces four confined-space-related pSIF events in the past quarter, that is the board conversation, not a spreadsheet of all 18,000 daily events.
ISO 45001:2018 clause 10.2 requires organisations to investigate incidents and nonconformities, determine root causes, and implement corrective actions. pSIF events detected by AI monitoring qualify fully as the near-miss incidents that clause 10.2 contemplates — they are events that "had the potential to result in injury and ill-health" (ISO 45001 §3.35 on incidents). Including pSIF detection counts in your 45001 corrective action records provides an audit trail that demonstrates proactive management, not reactive incident-counting.
Configuring AI alert tiers: a checklist for EHS teams
When setting up a computer vision monitoring system, the configuration of alert tiers translates your pSIF triage logic into the system's operating parameters. The following checklist covers the key decisions before go-live:
- Define the tier structure upfront. Agree before deployment whether you will use two tiers (critical/log) or three (critical/significant/log). Three tiers offer more management flexibility but require more review bandwidth — the right choice depends on team capacity.
- Map event types to tiers by default. Vehicle-pedestrian proximity and restricted zone entry near high-energy assets should default to tier 1 (critical). PPE non-compliance in general areas should default to tier 2. Routine access events should default to tier 3.
- Set escalation thresholds for frequency. Configure the system to upgrade an event's tier automatically if the same event type has been detected more than a defined number of times in a rolling 24-hour window at the same location — because frequency is a component of the pSIF score.
- Define the acknowledgement-and-close process per tier. Tier-1 events should require named acknowledgement by a supervisor within a specified window. Tier-2 events should close by end of shift. Tier-3 events should auto-close into the daily log.
- Review tier classification quarterly. Event data will reveal initial classifications that were wrong in either direction. A quarterly tier review refines the system using real site evidence.
- Calibrate proximity thresholds to site conditions. For vehicle–pedestrian and lifting events, the proximity threshold at which an event escalates to tier 1 should reflect actual site layout and vehicle speeds, not a default parameter taken from another deployment.
- Document the tier configuration as a controlled document. This forms part of the technical evidence that the system is operating as designed — which matters for RIDDOR investigations, ISO 45001 audits, and insurance reviews alike.
The offshore environments where SecureSafety first deployed — oil and gas installations where a single lapse in the right place can kill a crew — made this kind of triage thinking essential from day one. A system processing 18,000 events daily and reliably surfacing fewer than a handful of genuinely critical pSIF events in the same period is doing its job. The rest is evidence, learning, and trend data. Distinguishing between the two is how you turn AI monitoring from a data generator into a safety tool.
If you want to see how a pSIF triage model would apply to your site's current event patterns, book a demo and we will walk through it using your actual camera coverage.